The latest data from the Australian Bureau of Statistics (ABS) has found that household spending continued to rise in September, and 2021 Census data showed over 90% of Aussies own at least one vehicle, and more than half of Australians reported having two or more vehicles.
More people move to Queensland
ABS’ 2021 Census data has revealed that Queensland is the destination of choice for those looking for a new home, confirming what many across the real estate industry have been experiencing over the past few years.
Parts of the Sunshine State have seen property values soar, with demand for property in places like the Gold Coast, Brisbane, and other parts of South East Queensland earlier driven by lockdown-weary Melburnians and Sydney-siders.
In June 2021, Commonwealth Bank (CBA) research showed some of the most popular destinations included the Gold Coast, Sunshine, Noosa, Southern Downs, and Fraser Coast.
How do those 2021 figures compare to the ABS data?
The Australian Bureau of Statistics said that in the five years prior to 2021 Census, “… Queensland continued to record the largest net gain with more than 100,000 people moving from a different state or territory. This was followed by Tasmnia with a net gain of over 15,000 people, and the Australian Capital Territory with more than 10,000 people.”
ABS data showed New South Wales saw 102,000 people move out of the state, with fewer than 10,000 people leaving Victoria.
Mark Harding, Program Manager, Census said, “The 2021 Census asked questions about where people lived one year ago and five years ago.
“53 per cent of the population did not move home in the last five years. Of those who did move the majority (87 per cent) moved within the same state. Only one in ten moved to a different state.
“Census data captures the characteristics of people who’ve moved, allowing us, in turn to gain a better understanding of why they moved.
“The median age of people who moved within Australia between 2016 and 2021 was 33 years old, and they were more likely to rent than non-movers. Conversely, the median age of non-movers was 49 years old, and they were more likely to own their house outright or with a mortgage.
“This data suggests that people are moving for housing suitability and affordability as well as employment opportunities and then settling down later in life.”
The sea-change and tree-change widely reported was also confirmed, ABS said “The analysis also revealed an increase in people moving out of capital cities compared to previous Censuses.”
“Over the five-year period to 2021, there was a net loss of 160,100 people from Australia’s capital cities. This was a significantly greater loss than in 2016 and 2011, where there was a net loss of 43,000 people and 72,200 people, respectively.”
ABS, Census 2021
The ABS also said the movement “intensified” during Covid, with the one-year period before the 2021 Census seeing almost 60,000 people moving from capital cities (59,500). Sydney saw the largest exodus, with 49,100 leaving the city.
Household spending continues rise
Households continued to haemorrhage cash as spending over the month of September rose by 28 per cent compared to the same time last year, according to the ABS.
Jacqui Vitas, ABS head of macroeconomic statistics, said September 2022 saw the 19th consecutive month of increases through the year in total household spending, with increases in all spending categories.
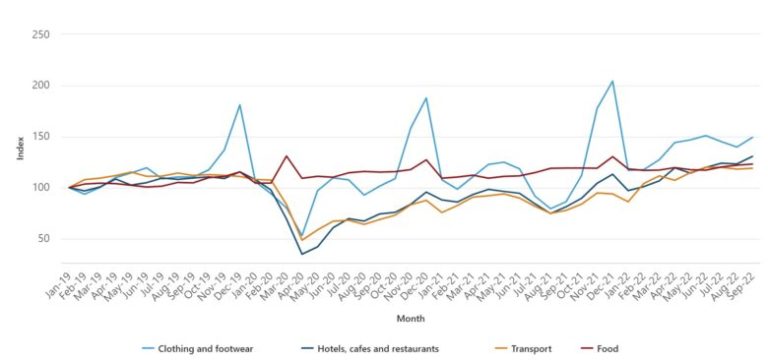
“There continued to be strong increases coming off the back of last year’s COVID-19 Delta lockdowns. Spending in Clothing and footwear (up 73.1 per cent), Hotels, cafes and restaurants (up 60.6 per cent), and Transport (up 53.0 per cent) all saw strong increases due to reduced spending from lockdowns in these categories.”
ABS data also showed spending was above pre-pandemic levels. Compared to September 2019, ABS data showed total household spending was 19.8 per cent higher in current price, calendar adjusted terms.
Clothing and footwear saw the largest spending increases, moving up 35.1 per cent, with recreation and culture up 31.4 per cent. Accessorising your home saw a 24.7 per cent increase under the furnishings and household equipment category, food also rose, up 17.6 per cent.
Household spending on selected spending categories, current price, index, calendar adjusted

9 in 10 Aussies own a car
The 2021 Census found that 91.3 per cent of households reported having at least one vehicle, and more than half (55.1 per cent) reported having two to more.
The data also showed that the average number of motor vehicles per household was 1.8.
Cars continued to carry copious quanta of people, as Census figures showed 52.7 per cent (6,347,498 people) of the Australian workforce drove to work by car. That was down from 2016 Census data where 61.5 per cent or 6,574,571 people drove to work. Cars remained the most popular mode of transport for commuting.
What will it take to get more Aussies onto public transport? Over the past year, many initiatives have been trialled including free travel lotteries in Queensland, electric bicycle trials in the Australian Capital Territory, and Sydney to keep its originally pop-up bike lanes.
Article source: thepropertytribune.com.au
from Queensland Property Investor https://ift.tt/2m5DQYq
via IFTTT